
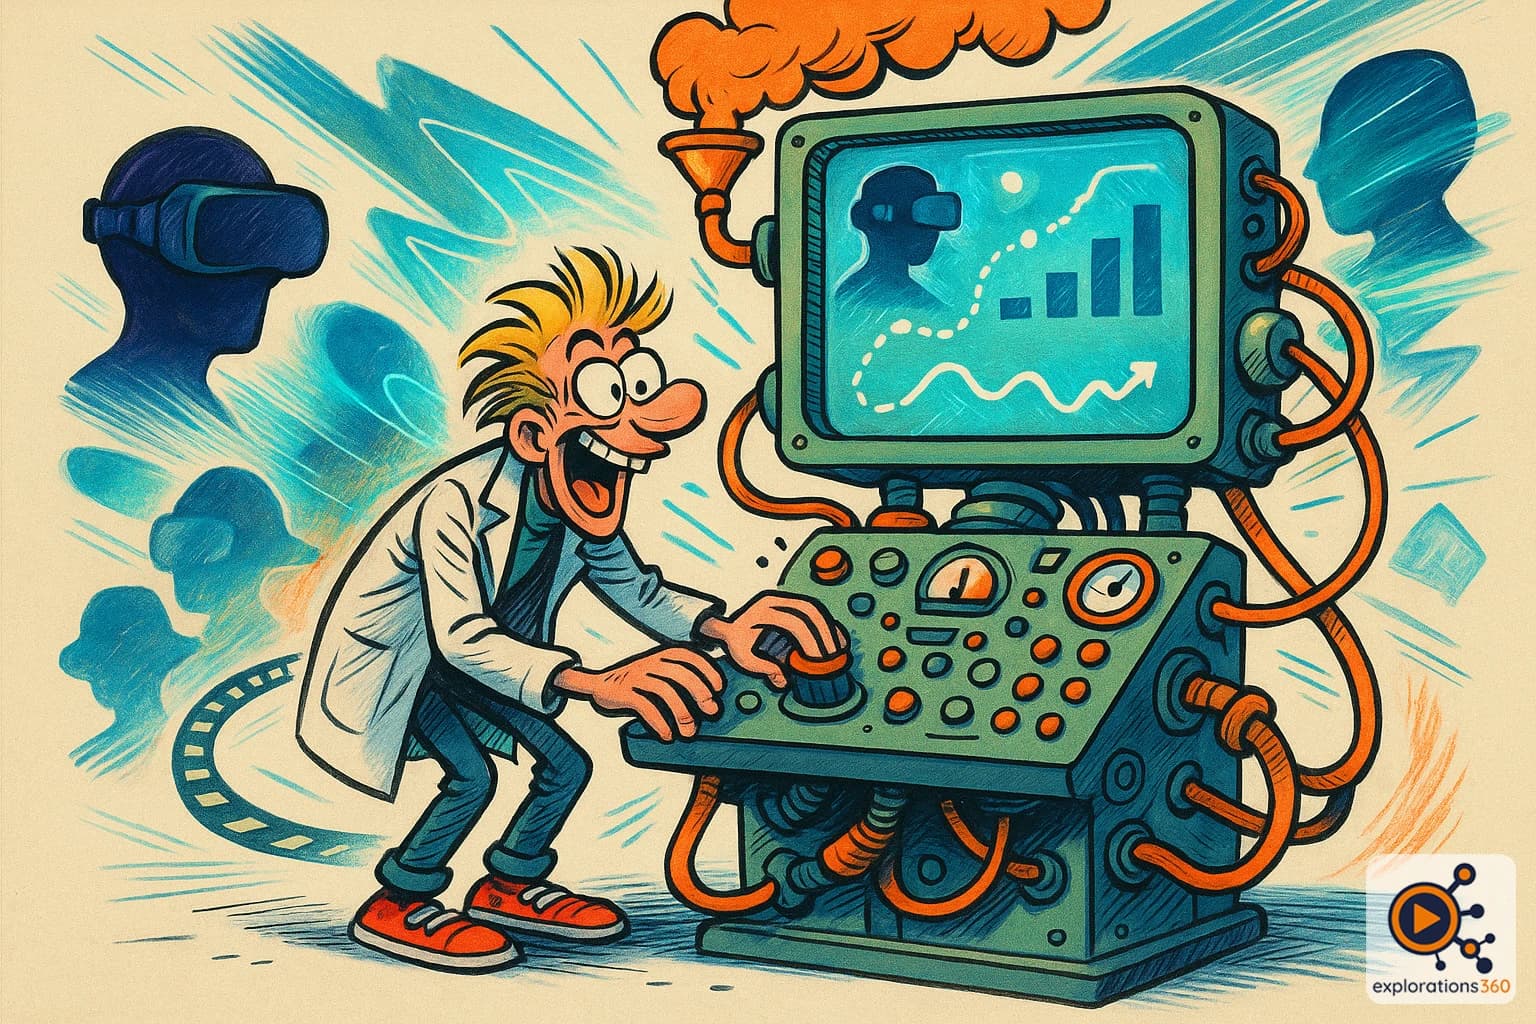
Explanation
The process of collecting, measuring, and analyzing usage data from immersive experiences to understand user behavior, measure effectiveness, and optimize content.
Real-world example
Knowing that 80% of virtual tour visitors spend more than 2 minutes in the kitchen and only 20 seconds in the garage - then redesigning the experience based on that insight.
Practical applications
- Measuring training effectiveness: completion rates, scores, time per module, error patterns
- Optimizing virtual tours: tracking which scenes attract the most attention and for how long
- Understanding user behavior: gaze heatmaps, navigation paths, interaction points
- Demonstrating ROI: concrete data to justify immersive technology investment
Types of analytics in XR
Behavioral analytics
- Navigation paths, time per zone, interaction points
- Gaze heatmaps (where users look)
- Points of drop-off or abandonment
- Comparison between user profiles
Example: A heatmap showing that 90% of virtual tour visitors miss the terrace - prompting a redesign of the navigation flow
Performance analytics
- Scores and completion rates
- Response time and accuracy
- Skill progression over time
- Comparison with benchmarks
Example: Tracking that average safety procedure completion time dropped from 12 to 7 minutes after 3 VR training sessions
VR scenario
A company deploys a VR fire safety training. Analytics reveal that 60% of employees fail at the same step: locating the emergency exit. The training is updated with a clearer visual cue. After the update, the success rate rises to 95%. Without analytics, the problem would never have been identified.
Why it matters in professional VR
- Analytics turns VR from a "wow effect" into a measurable, optimizable business tool
- Essential for justifying investment: concrete data rather than subjective impressions
- Analytics are what separate a demo from a professional deployment